
Dumping Fallacy
The 20k bitcoin buy that didn’t move the market
On 20 January 2026, Michael Saylor announced that Strategy had acquired 22,305 bitcoins. He even included that he paid ~$2.13 billion for them, which works out to a price of ~$95,284 per bitcoin.
As @denlillaapan observed a few days ago (https://stacker.news/items/1416021/r/Scoresby), it’s funny that these monster buys don’t seem to show up in the price. Seems like somebody buying 20k bitcoins ought to cause at least a little blip.
Afterall, if some horrible bear was selling that much bitcoin, people would be in the streets, rending their garments, wailing that the end was neigh. In fact, the famous 2014 BearWhale only sold 30k bitcoins – but people still remark its slaying every October. What gives?
Perhaps the buys do show up in the price and we just don’t recognize it. I decided to give this a test. So I got the price data for Bitcoin during the period when Strategy likely would have been buying all this bitcoin and made a chart.
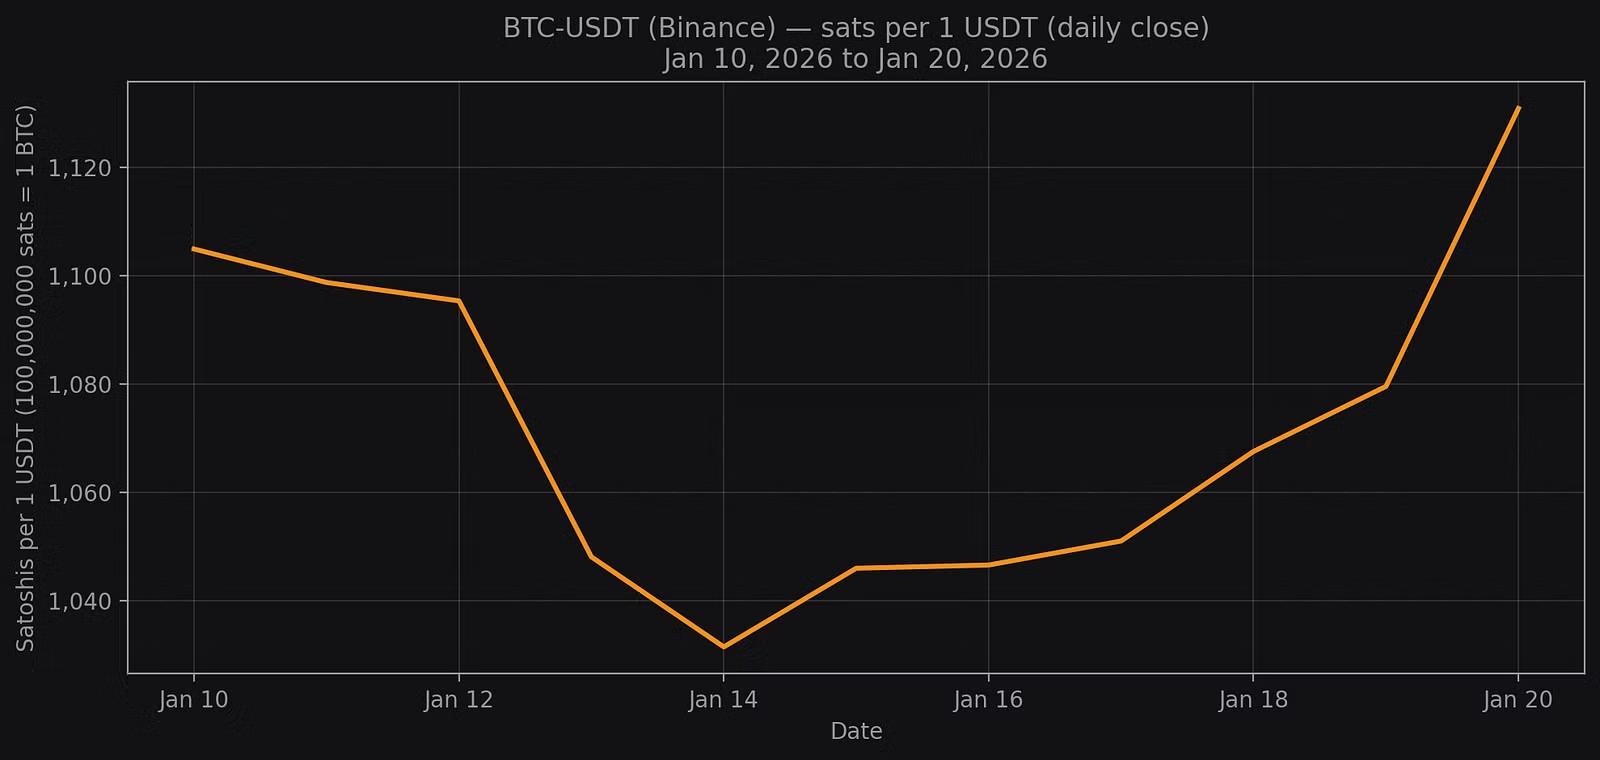
Now, you’ll notice something funny about this chart: the y-axis is sats per dollar (well, USDT actually, because I got the data from Binance and they don’t offer a BTC-USD trading pair). The chart also starts two days before Saylor’s previous announcement of a bitcoin buy to give a little buffer for capturing price action when they were acquiring this 20k bitcoin.
If Strategy can move the market by buying 20k bitcoins, we’d expect to see a nice L-shape or U-shape as the price of bitcoin goes up and the number of sats per dollar decreases while Strategy is gobbling up all the bitcoins for sale…
And this is what we see! Look at that: you can see Strategy moving the market.
Hang on, wait a minute…
Sadly, as you all can probably tell, I am not an economist, nor a statistician. It would be foolish to accept this one cherry-picked little bit of data as proof of anything.
We meed more data.
Strategy’s largest purchases of bitcoin in the last year or so
Perhaps we can find some kind of correlation if we make a similar chart for each one of these buys and compare them all. So that’s what I did.
| Dumping period | Dollar dump |
|---|---|
| 12 - 20 Jan 2026 | $2.13 billion |
| 5 - 12 Jan 2026 | $1.25 billion |
| 8 - 15 Dec 2025 | $980.3 million |
| 1 - 8 Dec 2025 | $962.7 million |
| 10 - 17 Nov 2025 | $835.6 million |
| 21 - 29 Jul 2025 | $2.46 billion |
| 9 - 16 Jun 2025 | $1.05 billion |
| 5 - 12 May 2025 | $1.34 billion |
| 21 - 28 Apr 2025 | $1.42 billion |
| 24 - 31 Mar 2025 | $1.92 billion |
| 18 - 24 Feb 2025 | $1.99 billion |
| 21 - 27 Jan 2025 | $1.1 billion |
| 13 - 21 Jan 2025 | $1.1 billion |
But wait! what’s with the sats per dollar?
I want to explain why I flipped the chart upside down and showed sats per dollar on the y-axis, rather than the normal way the bitcoin price is charted.
We’re all Bitcoiners here. We hold bitcoin and use bitcoin and so I see no reason why we should think about Strategy’s actions as bitcoin buys. As far as us Bitcoiners are concerned, he’s dumping dollars. And what I want to know is if Strategy is wrecking the price of the dollar when he sells all his dirty fiat papers for the orange electric money of the future.
I changed the y-axis because that’s how Bitcoiners price things: Saylor is dumping dollars.
Is Saylor crashing the price of the dollar?
Here is a chart that shows each of Saylor’s 13 major dollar dumps between now and 1 January 2025. The chart shows the change in sats per dollar on the y-axis and the number of days since Saylor’s previous treasury update on the x-axis.
I color-coded each line based on the size of the dump. Lighter colored lines mean bigger dumps (biggest dump is $2.46 billion, the smallest is $962.7 million).
Each line starts two days before Saylor posted a bitcoin treasury update that precedes the announcement of a major dollar dump and extends for two days after the announcement of the dump itself. (So if Saylor announced a major dump on the 27th of July, I looked back through his X feed to see when his previous dump announcement took place and then added two days on each side of this period).
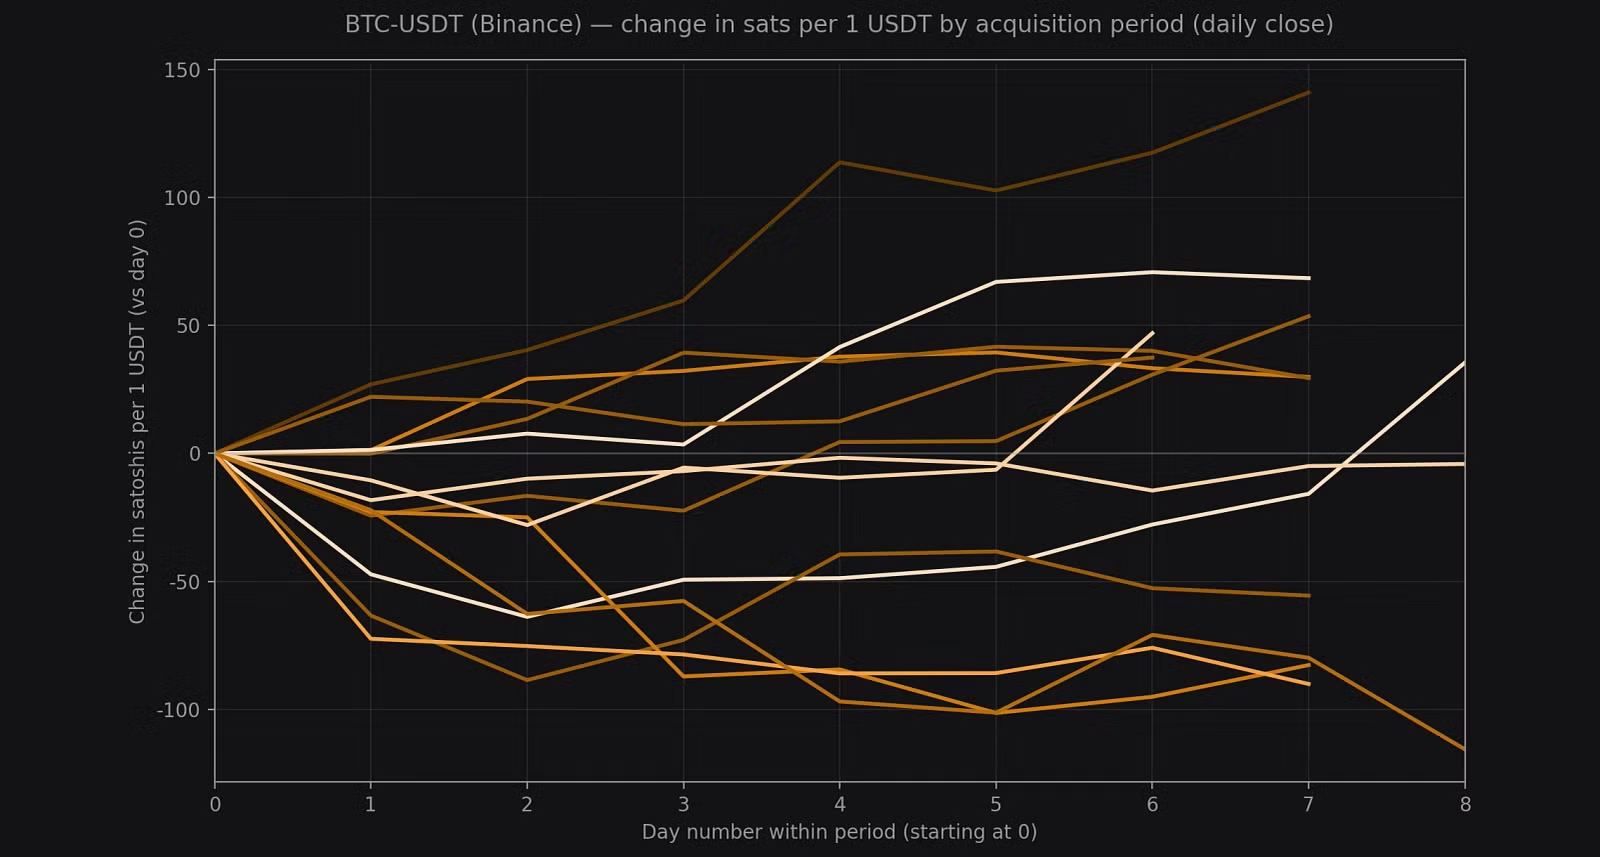
There doesn’t seem to be much correlation
To demonstrate a correlation between Strategy dumping dollars and the price of dollars falling (in bitcoin terms) we would have seen that the lighter colored lines tend to be on the bottom of the chart – ideally below the midline (zero change in sats per dollar) and especially light lines should show the greatest dip below zero).
If you squint, maybe you can see this correlation. Like, it does seem like the light colored lines tend to be lower on the chart, but when I have Chat and Gemini do regressions on the data, they tell me the correlation is not statistically meaningful – even when accounting for overall trading volume during those periods.
Another thought that occurred to me was that perhaps we could see evidence of Saylor’s dollar dumping activity affecting price if we compared the periods where Saylor was dumping particularly large numbers of dollars with those periods where he was dumping comparatively few dollars.
In order to do this, I ventured into Saylor’s X archives again (pity me! the sheer volume of AI slop featuring a muscular Saylor doing improbable things in various states of undress nearly broke me) and found the occasions where Strategy announced purchases of bitcoin that were smaller than 300 bitcoins.
| Dumping period | Dollar dumps |
|---|---|
| 27 Jan - 03 Feb 2025 | 0 |
| 25 Feb - 03 Mar 2025 | 0 |
| 03 - 17 Mar 2025 | $10.7 million |
| 17 - 23 Jun 2025 | $26.0 million |
| 01 - 11 Aug 2025 | $18.0 million |
| 22 - 29 Sep 2025 | $22.1 million |
| 01 - 13 Oct 2025 | $27.2 million |
| 14 - 20 Oct 2025 | $18.8 million |
| 18 Nov - 01 Dec 2025 | $11.7 million |
Then I made the chart again with these smaller buys added as shades of blue lines. I’ll admit it got a little ugly.
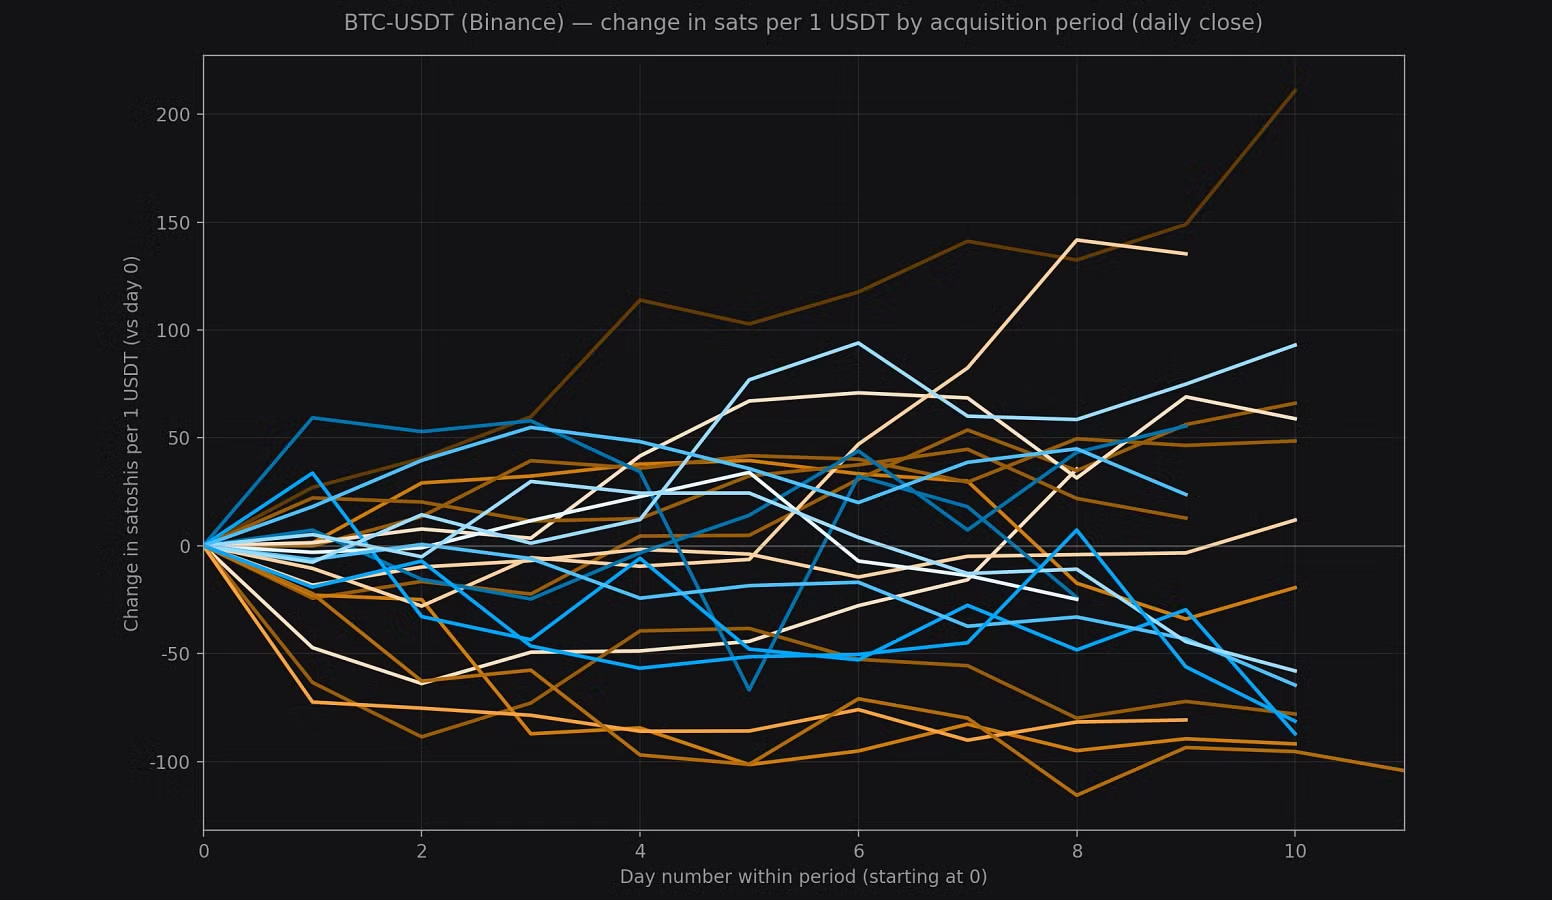
If we think dollar dumping causes the sats-per-dollar rate to fall, we should tend to see more negative area above the lines from periods with more dollar dumping and less negative area from periods with less dollar dumping.
Unfortunately, there doesn’t seem to be a correlation here either.
So why isn’t Saylor crashing the price of dollars by dumping them?
The most obvious answer is that if you look at all the things dollars trade against (everything?) Saylor’s dump just isn’t very big. In fact, it is downright insignificant.
But another answer is that just as Saylor dumped the dollars, his trading partner(s) dumped their bitcoin.
Hello, supply and demand, my old friend / I’ve come to talk with you again
Supply
When Saylor dumps his dollars he doesn’t change the number of dollars that exist. Apparently, the cool kids call the number of dollars that exist the stock (while our government calls it M3 money supply or M2 if you’re small fry like me).
However, let’s do a thought experiment. Imagine that instead of Strategy, we are talking about Tether. In reality, Tether is a respectable company and I’m sure they would never do this, but let’s pretend that they just minted 2 billion USDT out of thin air and dumped it on the market.
This USDT-with-no-backing would indeed be an increase to the stock of USDT. But when we say Tether “dumps” it on the market, we mean they are trading it with someone – not just setting up a faucet and giving it out for free. They are trading it with people for something.
When they dump all this USDT, do we expect the price of USDT to go down? Probably not…in dollar terms (it’s a stablecoin, remember? as long as people believe Tether will redeem it for a dollar, we’d expect the price to remain at one dollar – no matter how much they dump), but what about the price in terms of bitcoin? Because that’s what I’m really interested in.
Sure, there could be a bank run and a collapse ala Terra-Luna if people started to get worried that the USDT tokens weren’t actually backed, but think about what happens before that: does all this newly created USDT mean it will take more USDT to buy 1 bitcoin than it did before?
Many people seem to think the answer is yes and I agree. But as we said at the top: Saylor can’t create new dollars, so he isn’t changing the stock.
Demand
If Saylor dumps dollars for bitcoins, someone else dumps bitcoins for dollars – at exactly the same rate as Saylor. Saylor can’t get the bitcoins unless someone else agrees to dump them.
When Saylor announces one of his big dollar dumps like this:

Someone else could just as truthfully be making an announcement like this:

Which one matters more for where you think the price will go?
One other interesting point is that it often feels like Saylor gets a bad deal when he dumps his dollars. It seems like he makes these huge dollar dumps and he ends up getting less bitcoin for his dollars. Isn’t this further evidence that dumping dollars crashes the price?
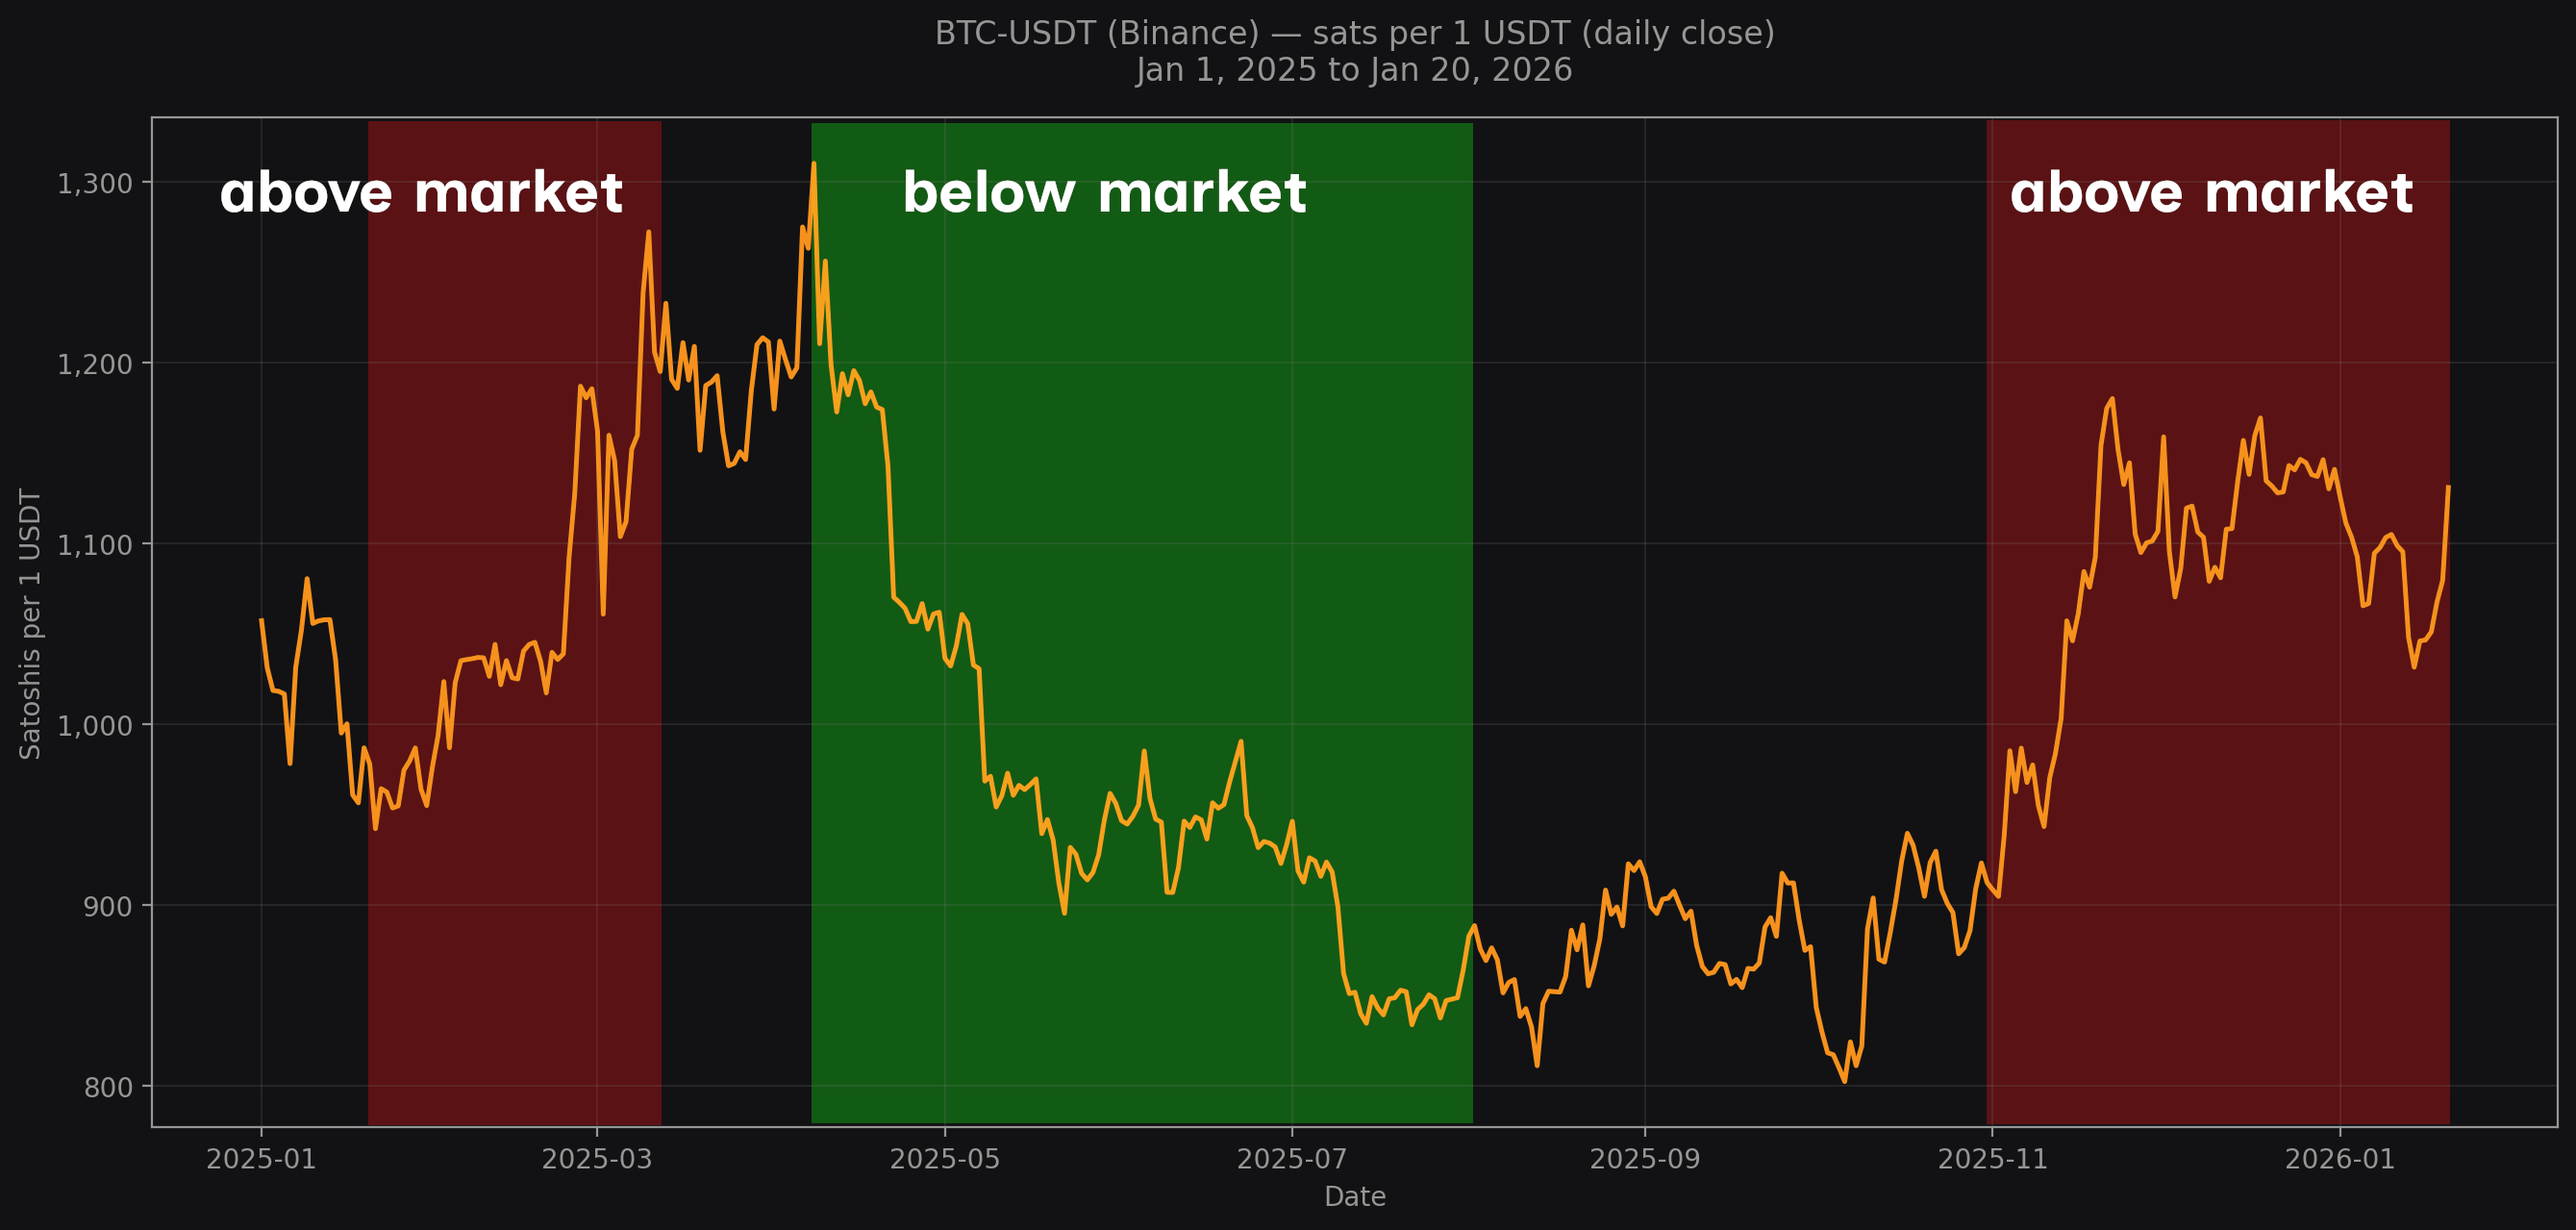
To check on this, I looked at the average close for the 7 days before any time Saylor announced a major dump, and then compared that average to the amount of bitcoin he got for his dollars.
When you chart the times his dollars get less bitcoin than what others were getting in the market and the times they get more bitcoin, the answer is pretty clear: when the dollar is trending stronger (sats/dollar increasing), Saylor is likely to get less bitcoin for his dollars. When the dollar is trending weaker (sats/dollar decreasing), he’s likely to get more bitcoin for his dollars.
We have this sense that Saylor’s choice to dump dollars for bitcoin is a “vote” of sorts against the dollar and for bitcoin – and so it feels like the dollar should have just gotten spanked at the polls. If you don’t feel this way about Saylor and dollars, consider how you feel about the statement: dumping a fork coin will crash its price.
To me, at least, this statement feels like a battle call: I will sally forth and dump my fork coins on the market, slaying the vile fork into economic oblivion. But…
Markets aren’t democracies
A better metaphor is that markets are ecosystems, where everything is fighting for survival. You don’t necessarily have to win to survive – many things find their niche, however small, and find some kind of stability.
A group of bitcoiners thinking that selling dollars or fork coins will crash their price is like a group of monkeys thinking they can push a certain fruit tree to extinction by refusing to eat its fruit.
A decision to sell isn’t a vote, it’s a choice to expend time and energy doing something. Maybe the gamble pays off and you end up with more of what you want than you otherwise would have. But maybe you would have been better off putting your energy elsewhere. You cannot draw a causal relationship between dumping dollars or fork coins and a movement in the market.
Sure, selling the fork coin might allow you to express more demand for bitcoin…but you might have been able to express even more demand for bitcoin by using the time and energy to build your business.
If Saylor can’t move the market when he dumps billions of dollars, what makes us think dumping a few fork coins will move the fork coin market?
I’ve been reading Cryptoeconomics again, and this is an attempt to work through some of the ideas in the chapter called “Dumping Fallacy” which I am copying below.
Cryptoeconomics: Dumping Fallacy
There is a theory that selling units from one side of a split coin for units of the other reduces the relative utility of the sold coin. However each sale requires a buyer. As a trade the action is symmetrical and therefore the theory is invalid.
There is a related theory that exchanging units from one side of a split coin constitutes dumping of that coin, which reduces its utility. The theory simply misrepresents the concept of dumping. Dumping is state subsidy (not to be confused with Bitcoin subsidy) of a product sold in another state. It is a levy on the taxpayers of the subsidizing state, typically applied to establish market share for the product. In the case where demand is elastic, the subsidy increases sales volume for the product by reducing price relative to the otherwise market price. The lower price increases demand, by capturing buyers with lower marginal utility for the product, until the market clears. In contrast to dumping, trading at market price doesn’t reduce price because it is not subsidized.
Finally, there is a related theory that reduction of hoarding generally reduces exchange prices of the hoarded property. This is true, however a transfer is not a reduction to hoarding levels unless the buyer of the hoarded property subsequently hoards it less than the seller. It is an error to assume this is the case.